SCIENTIFIC STUDIES
NY NJ PA AIRSPACE REDESIGN
Availability Of Scientific Study
The aviation industry was deregulated to jumpstart a failing industry with the Airline Deregulation Act of 1978. Deregulation cancelled programs to study the effects of jet engine emissions and sound pollution in part because they were seen as barriers to growth.
Since the 1970's the aviation industry has seen exponential growth. US transportation policy focused on aviation as the primary transportation mode, which was further supported by globalization. With explosive growth, the impacts of Aviation jet engine noise and emission has seen increased scrutiny.
Without public funding and policy requiring extensive impact study, environmental organizations like the NRDC became more involved in the issue. In 1996 they published a landmark study on the effects of aircraft emissions on air quality which was a wake-up call to environmentalists. This was followed by landmark studies by the World Health Organization, the intergovernmental panel on Climate Change and the United Nations Environment council and State Environmental Protection Agencies.
The industry responded by producing studies of their own. NASA, ICAO, FAA, BOEING, GE to name a few. The evidence showed clearly that unfortunately Aviation emission are a cause of concern.
Environmental Organizations
- International Civil Aviation Organization Air Transport Bureau (ATB): to achieve maximum compatibility between the safe and orderly development of civil aviation and the quality of the environment
- NEPA Emissions Factors and Policy Applications Center (EFPAC)
Human Health Risk Assessment
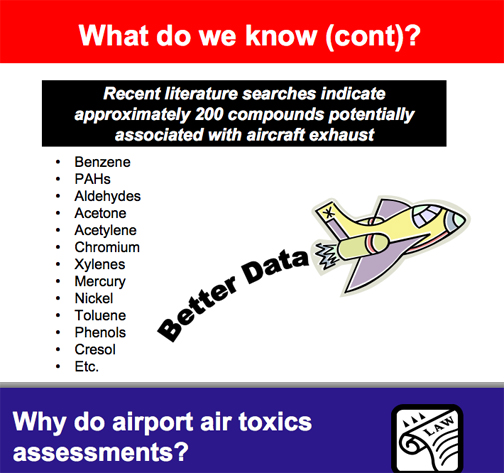
Health risks for more then 150 compounds (i.e., 147 VOCs, 15 carbonyl compounds, and 15 PAHs) and 4 criteria pollutants (i.e., CO, SO2, NOx, and PM10) are known to be present in petroleum combustion products such as jet engines. 1,3-butadiene, formaldehyde, acrolein are cancer causing.
According to the Internal Civil Aviation Organization's Air Transport Bureau, "Aircraft emissions give rise to important environmental concerns regarding their global impact and their effect on local air quality at ground level."
Environmental Protection agency Air Pollutant Emissions Factors
Scientific Study:
- Oxford Journals: Toxicological Sciences: Assessment of Skin Absorption and Penetration of JP-8 Jet Fuel and Its Components
- Center of International Study: Engine Emission Alteration in the near field of Aircraft
- NEPA Airports And Air Toxins
Article Published in American Journal:
| By Julie Steenhuysen Thu Sep 20, 5:04 PM ET CHICAGO (Reuters) - Tiny particles of air pollution -- less than one tenth the width of a human hair -- can trigger clotting in the blood, U.S. researchers said on Thursday in a finding that helps explain how air pollution causes heart attacks and strokes. Large population studies have shown pollution from the exhaust of trucks, buses and coal-burning factories increases the risk of fatal heart attacks and strokes. "We now know how the inflammation in the lungs caused by air pollutants leads to death from cardiovascular disease," said Dr. Gokhan Mutlu of Northwestern University in Chicago, who studied the effects of air pollution in mice. Lungs inflamed by pollution secrete interleukin-6, an immune system compound that sparks inflammation and has been shown to make blood more likely to clot. Mutlu got a clue about the clotting issue two years ago when he was studying the effects of air pollution on heart failure in mice. Mice who had been exposed to pollution bled significantly less. Mice exposed to pollution showed a 15-fold increase in interleukin-6 just 24 hours later. That time frame is important because some studies have shown a spike in air pollution can boost heart attacks with 24 hours. He said most people understand that high levels of air pollution can make lung diseases such as asthma worse. "The same thing is not known for patients with coronary artery disease or congestive heart failure," Mutlu said. "I think we need to increase the awareness of this link among those individuals." |
Air Quality Degradation
Below is a slide from a research group at Berkley. The industry has pressured the government to de-fund programs to study the effects of aircraft jet engine emissions. The potential health effects are significant based on the content of jet engine emission.
"Most Nox emissions from aircraft have been found to occur in approach, take off and climb (LTO Cycle)" - United Nation's Aviation Agency
According to the European Commission, Emissions from aircraft raises the risk for stroke, coronary heart disease and increased blood pressure.
According to a Congressional report, (Crowley 2001); Airport air pollution is similar in scope to that generated by local power plants, incinerators, and refineries, yet is exempt from many of the rules other industrial polluters must follow. For example, one 747 arriving and departing from an airport in New York City produces as much smog as a car driven over 5,600 miles, and as much polluting nitrogen oxides as a car driven nearly 26,500 miles.
While the government has effectively required cars to undergo emissions inspections (with resulting improvements in emissions and efficiency), airplanes have not received the same scrutiny. Meanwhile, air travel is increasing in popularity twice as fast as car travel and is projected to double within the next 20 years.*1
According to Larry West, an environmentalist hired by the FAA, aircraft emissions contribute to certain health risks; "The U.S. Citizens Aviation Watch Association has cited several studies linking pollutants common around airports--such as diesel exhaust, carbon monoxide and leaked chemicals--to cancer, asthma, liver damage, lung disease, lymphoma, myeloid leukemia, and depression.
"Pollution produced by LaGuardia Airport is a significant contributor to the overall asthma rates in the communities surrounding the airport. According to the American Lung Association's estimates of the prevalence of lung disease, there are 80,105 adults with asthma in Queens and there are 27,588 kids with asthma." according to Crowley's report.
From NJCAAN: noise abatement Policies for FAA, airports and airlines
Airspace Redesign Fatally Flawed—Plan Excludes Emissions Mitigation Strategies
Even though the Federal Aviation Administration’s (FAA’s) Metro Airspace Redesign plan is designed to increase airport facility capacity, the agency excluded any airport emissions mitigation strategies to be included with this project. The preferred alternative also increases flight distances by 3.7 miles on average. Finally, certain procedures redirect traffic over residential communities that now are flown initially over commercial and industrial corridors. Given the “significant” public health, safety, and welfare, concerns generated by airport emissions in the metropolitan area, the New Jersey Coalition Against Aircraft Noise (NJCAAN) believes that the FAA environmental review of the impacts of the project is fatally flawed. The FAA needs to include airport emissions reduction strategies with any plan that it develops.
The FAA states that the project would “reduce” emissions. However, this assertion is based on a seriously flawed methodology that the New Jersey Coalition Against Aircraft Noise (NJCAAN) will challenge in court. This flawed methodology includes an inaccurate assumption with regard to the project’s overall operations in the FAA’s operations baseline and also an inaccurate assumption with regard to air carrier behavior.
Unfortunately, the FAA excluded the U.S. Environmental Protection Agency (U.S. EPA) and state environmental regulatory agencies such as the New Jersey Department of Environmental Protection (NJ DEP) in the development phase of the project. However, it included the aviation industry in two joint FAA/aviation industry committees. No surprise that emissions mitigation is excluded from project recommendations given this bias and that it would by costly for the aviation industry to address.
The last time that NJCAAN is aware of that the US EPA studied emissions in the metro area was in 1999. The US EPA projected a 67% increase in nitrogen oxides over a 20-year period (see table and study summary below).
Robert Belzer
President, NJCAAN
www.njcaan.org
1990-2010 Commercial Aircraft Emissions (short tons/year) Variable Mixing Height—Metro New York (EWR, LGA, JFK)
1990 2010 % INCREASE
Increase Landing & Takeoffs (LTOs) 383,206 452,950 18%
Volatile Organic Compounds 3,025 4,839 60%
Carbon Monoxide 8,712 12,808 47%
Nitrogen Oxides 5,729 9,574 67%
Sulfur Dioxide 270 364 35%
Evaluation of Air Pollutant Emissions from Subsonic Commercial Jet Aircraft
United States Environmental Protection Agency, April 1999
Study Internet Link: http://www.epa.gov/otaq/regs/nonroad/aviation/r99013.pdf
Executive Summary
The U.S. Environmental Protection Agency’s (EPA’s) Office of Mobile Sources initiated this study in order to assess the existing and potential impact of aircraft emissions on local air quality in ten selected cities. (Pp. E-1)
The analytical results of the study confirm that commercial aircraft emissions have the potential to significantly contribute to air pollution in the ten study areas. Study results indicate that in 1990, for NOx, the aircraft component of the regional mobile source emissions ranges from 0.6% to 3.6%. In the 2010 projection year for all cities studied, the projected ground-level emissions from commercial aircraft increased in absolute terms. (Pp. E-1)
Introduction
Commercial aircraft comprise almost 70% of oxides of nitrogen (NOx) emissions from the total aircraft sector (commercial, military, and general aviation). They are one of the fastest growing segments of the transportation sector’s regional pollutant contribution. (Pp. 1.1)
The ten cities were selected based on their preexisting status as locations where air quality problems currently exist or are likely to become more significant. (Pp 1.1)
The New York metro area is currently rated severe-17 ozone nonattainment area. New York-Northern New Jersey-Long Island. (Pp. C-3)
The results indicate that while overall emissions from these facilities will remain the same or decrease due to anticipated pollution controls on ground-support and service vehicles, aircraft –induced NOx pollution, depending on the specific scenario, increase by a factor of two to three between 1992 and 2015. (Pp. 1-3)
The five major air pollutant species which comprise the most significant emissions from commercial jet aircraft are volatile organic compounds (VOCs), carbon monoxide (CO), oxides of nitrogen (NOx), particulates (PM), and sulfur dioxide (SO2).
VOCS and CO emissions rates are highest when engines are operating at low power, such as when idling or taxiing. Conversely, NOx emissions rise with increasing power level and combustion temperatures. Accordingly, the highest NOx emissions occur during takeoff and climbout. (Pp. 2-1)
…the rate at which engine emits a particular pollutant is directly related to its activity. both the frequency and mode of operations are important components of this activity. (Pp. 2-3)
Section Four
In non attainment areas with large airport facilities, commercial aircraft emissions represent a growing percentage of the regional area source inventories as other sources decrease due to implemented controls. (Pp. 4-1)
In each of the ten cities, commercial jet aircraft are a larger percentage of the inventory in 2010 than in 1990. (Pp. 4.1)
Even in regions such as Los Angeles and New York, where aircraft are less than the 5 percent of the total mobile source emissions, the percent contribution of aircraft to regional NOx more than doubles by 2010. (Pp. 4-1)
Representative Health Effects of Air Pollutants
Ozone: Lung function impairment, effects on exercise performance, increased airway responsiveness, increased susceptibility to respiratory infection, increased hospital admissions and emergency room visits, and pulmonary inflammation, lung structure damage.
Carbon Monoxide: Cardiovascular effects, especially in those persons with heart conditions (e.g., decreased time to onset of exercise-induced angina).
Nitrogen Oxides: Lung irritation and lower resistance to respiratory infections.
Particulate Matter: Premature mortality, aggravation of respiratory and cardiovascular disease, changes in lung function and increased respiratory symptoms, changes to lung tissues and structure, and altered respiratory defense mechanisms.
Volatile Organic Compounds (VOCs): Eye and respiratory tract irritation, headaches, dizziness, visual disorders, and memory impairment.
Representative environmental effects of air pollutants (Pp. 1-5)
Ozone: Crop damage, damage to trees and decreased resistance to disease for both crops and other plants.
Carbon Monoxide: Similar health effects on animals as on humans.
Nitrogen Oxides: Acid rain, visibility degradation, particle formation, contributions to ozone formation.
Particle Matter: Visibility degradation and monument and building soiling, safety effects on aircraft from reduced visibility.
Volatile Organic Compounds: Contribution towards ozone formation, odors and some direct effects on buildings and plants.
Conclusions: Overall, this report provides an estimation of the contribution of aircraft to air quality emissions in ten urban areas, confirms that investigations of cost-effective control options on aircraft emissions is warranted, and highlights to need for improvements in the quality of national level data as noted by reviews of the draft study if more certainty is desired. (Pp. 5-1)
1990-2010 Commercial Aircraft Emissions (short tons/year) Variable Mixing Height—Newark (EWR): 1990 2010 Increase
Landing & Take Offs (LTOs) 134,124 183,381 37%
Volatile Organic Compounds 766 1,367 75%
Carbon Monoxide 2,210 3,603 63%
Oxides of Nitrogen 1,554 2,983 92%
Sulfur Dioxide 78 118 51%
1990-2010 Commercial Aircraft Emissions (short tons/year) Variable Mixing Height—LaGuadia (LGA) 1990 2010 Increase
Landing & Take Offs (LTOs) 154,700 158,209 2%
Volatile Organic Compounds 867 1,788 106%
Carbon Monoxide 2,446 3,681 50%
Oxides of Nitrogen 1,644 2,840 73%
Sulfur Dioxide 87 103 18%
1990-2010 Commercial Aircraft Emissions (short tons/year) Variable Mixing Height—Kennedy (JFK) 1990 2010 Increase
Landing & Take Offs (LTOs) 94,382 111,360 18%
Volatile Organic Compounds 1,392 1,683 21%
Carbon Monoxide 4,057 5,523 36%
Oxides of Nitrogen 2,531 3,750 48%
Sulfur Dioxide 105 143 36%
1990-2010 Commercial Aircraft Emissions (short tons/year) Variable Mixing Height—Newark (EWR): 1990 2010 Increase
Landing & Take Offs (LTOs) 134,124 183,381 37%
Volatile Organic Compounds 766 1,367 75%
Carbon Monoxide 2,210 3,603 63%
Oxides of Nitrogen 1,554 2,983 92%
Sulfur Dioxide 78 118 51%
*1. Based on FLYING OFF COURSE: Environmental Impacts of America's Airports, report by the Natural Resources Defense Council.
- Internal Civil Aviation Organization Studies
- Special Report on Aviation and Global Atmosphere
- NASA- study on Aircraft emissions and Air Quality Degradation
- ARGONNE NATIONAL LAB- Impact of aircraft emissions on air Quality
- UN Aviation Agency Actions to combat Aircraft Emissions
- UK's National Aircraft Emissions Inventory studies
- Nature Journal of Science- Aircraft emissions dabates
- Environmental Studies Associates
|
NASA Fact Book on Aviation Emissions:
A jet engine is an internal combustion engine, just like an automobile engine is. In a jet engine, the fuel and an oxidizer combust (or burn) and the products of that combustion are exhausted through a narrow opening at high speed. Modern jet engine fuel is primarily kerosene, the same fuel used to heat homes in portions of the U.S. Kerosene, a flammable hydrocarbon oil, is a fossil fuel. Burning fossil fuels primarily produces carbon dioxide (CO2) and water vapor (H2O). Other major emissions are nitric oxide (NO) and nitrogen oxide (NO2), which together are called NOx, sulfur oxides (SO2), and soot.-NASA's Glenn Research Center |
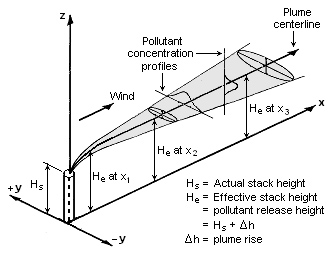
This is a diagram of emissions from a stack burning fossil fuels. Not unlike the emissions released by jet engines, pollutants are dispersed at different atmospheric levels according to altitude.
As published in the Environmental Protection Agency:
Emissions Factors & AP 42
An emissions factor is a representative value that attempts to relate the quantity of a pollutant released to the atmosphere with an activity associated with the release of that pollutant. These factors are usually expressed as the weight of pollutant divided by a unit weight, volume, distance, or duration of the activity emitting the pollutant (e.g., kilograms of particulate emitted per megagram of coal burned). Such factors facilitate estimation of emissions from various sources of air pollution. In most cases, these factors are simply averages of all available data of acceptable quality, and are generally assumed to be representative of long-term averages for all facilities in the source category (i.e., a population average).
The general equation for emissions estimation is:
E = A x EF x (1-ER/100)
where:
• E = emissions;
• A = activity rate;
• EF = emission factor, and
• ER =overall emission reduction efficiency, %
In 2000 the FAA created Categorical Exclusions on air quality impacts to Human Health for aircraft flying above 3000 feet. The office of Environment & Energy made it legal to ignore any human health impact by Aircraft Engine Emissions in this report:
Further Reading on Jet Engine Emissions
- http://www.faa.gov/regulations_policies/policy_guidance/envir_policy/media/aeprimer.pdf
- http://www.atag.org/files/FAST%20FACTS-120341A.pdf
- http://www.iata.org
- U.S. Department of Transportation, Bureau of Transportation Statistics, Transportation Indicators
http://www.bts.gov/publications/transportation_indicators/december_2002/ , December 2002.
- U.S. Department of Transportation, Federal Aviation Administration, FAA Long-Range Aerospace
Forecasts Fiscal Years 2015, 2020 and 2025, Office of Aviation Policy and Plans, FAA-APO-00-5,
http://apo.faa.gov/lng00/lng00.pdf, June 2000.
- GDP - U.S. Department of Commerce, Bureau of Economic Analysis, National Accounts Data
http://www.bea.gov/bea/dn1.htm; RTM - U.S. Department of Transportation, Bureau of Transportation
Statistics, Historical Air Traffic Statistics, http://www.bts.gov/oai/indicators/airtraffic/annual/1981-
2001.html; VMT – U. S. Department of Transportation, Federal Highway Administration, Traffic Volume
Trends, December 2002 http://www.fhwa.dot.gov/ohim/tvtw/02dectvt/tvtdec02.pdf.
- Wickrama, Upali, International Civil Aviation Organization, Committee on Environmental Protection,
Forecasting and Economic Analysis Support Group, Report of the FESG/CAEP/6 Traffic and Fleet
Forecast, copy of Figure 8, 2003 op. cit. - U.S. Environmental Protection Agency, National Air Quality 2001 Status and Trends,
http://www.epa.gov/airtrends/aqtrnd01/, September 2002.
[http://www.epa.gov/air/airtrends/aqtrnd03/fr_table.html]
- Waitz, I. A., Massachusetts Institute of Technology, private communication based on Boeing data,
November 2003.
- U.S. Environmental Protection Agency, Average Annual Emissions, All Criteria Pollutants; Years
Including 1980, 1985, 1989-2001, http://www.epa.gov/ttnchie1/trends/index.html, February 2003.
- Clean Air Act Amendments of 1990, Title I – Provisions for Attainment and Maintenance of National
Ambient Air Quality Standards, Section 101(d)(1), November 15, 1990.
- U.S. Environmental Protection Agency, 8-Hour Ground-level Ozone Designations,
http://www.epa.gov/ozonedesignations/statedesig.htm, May 6, 2004.
- U.S. Department of Transportation, Federal Aviation Administration, Enplanement Activity at Primary
Airports, http://www.faa.gov/arp/planning/stats/2002/CY02CommSerBoard.pdf , November 6, 2003.
- U.S. Environmental Protection Agency, Classifications of Ozone Nonattainment Areas, op.cit.
- U.S. Department of Transportation, Federal Aviation Administration, Federal Highway Administration
(cooperating agency), Final Environmental Impact Statement for 9,000-Foot Fifth Runway and Associated
Projects: Hartsfield Atlanta International Airport, August 2001.
18
Illinois Environmental Protection Agency, Illinois 1999 Periodic Emissions Inventory And Milestone
Demonstration, December, 2001. The higher value for in the area inventory data in the table is for a typical
summer day, which is the ozone season and probably represents a worst case since it is the most active
period for aviation activity. The non-road data also is based on typical summer day. The lower value, which
is more representative for an annual value is from U.S. Department of Transportation, Federal Aviation
Administration, Final Environmental Assessment for the World Gateway Program and Other Capital
Improvements: Chicago O’Hare International Airport, Chicago, Illinois, June 21, 2002.
- South Coast Air Quality Management District, Emissions by Category, 2001 Estimated Annual Average
Emissions, South Coast Air Basin.
http://www.arb.ca.gov/app/emsinv/emssumcat_query.php?F_DIV=0&F_YR=2001&F_AREA=AB&F_AB =SC , 2001.
- Texas Natural Resource Conservation Commission, Dallas/Fort Worth Ozone Nonattainment Area
Emission Data, http://www.tnrcc.state.tx.us/air/aqp/ei/rsumdfw.htm, 1996 inventory data. Data includes all
airports in the nonattainment area including, DFW International Airport, Dallas Love Field, and Alliance
Airport. - U.S. Department of Transportation, Federal Aviation Administration, Final Environmental Impact
Statement Runway 8L-26R and Associated Near-Term Master Plan Projects; George Bush Intercontinental
Airport/Houston, July 2000. - Compilation of data from the SIP inventories for New York and New Jersey provided by Mr. Raymond
Forde, Region 2, U. S. Environmental Protection Agency, June 16, 2004. Additional data provided by Mr.
Kevin McGarry, New York State Department of Conservation and Ms. Tonalee Key, New Jersey
Department of Environmental Protection. - Agyei, Kwame, Puget Sound Clean Air Agency, airport emissions calculated using EDMS 4.0; area non-
road and total emissions from 1999 Air Emission Inventory Summary spreadsheet, February 11, 2003. - Nonattainment area non-road and total NOx emissions, 68 FR 25431, May 12, 2003; Airport emissions
escalated from 1995 estimate by URS Greiner, Inc. (1997) based on 2000 data provided by Tony Petruska, U.S. EPA. - Massachusetts Department of Environmental Protection, Massachusetts Periodic Emissions Inventories
1999, April 2003, for nonattainment area off-road emissions and total emissions, which are based on
summer day emissions. U.S. Department of Transportation, Federal Aviation Administration, Final
Environmental Impact Statement, Logan Airside Improvements Planning Projects: Boston Logan
International Airport, June 2002 for Logan Airport emissions, which are typical for an annual value. - U.S. Environmental Protection Agency, National Air Pollutant Emission Trends, 1990-1998,
http://www.epa.gov/ttn/chief/trends/trends98/index.html, March 2000.
- For NOx, aircraft represent anywhere from 60 to 80 percent of total airport emissions with the balance
coming from the other sources like ground support equipment and ground access vehicles. This is based on
a review of recent Environmental Impact Statements for eleven airports (ATL, BOS, CLE, DFW, IAD,
IAH, LAX, ORD, PTI, SFO, and STL). - For more information about the production of contrails by aircraft, see U.S. Environmental Protection
Agency, Aircraft Contrails Factsheet, http://www.epa.gov/otaq/regs/nonroad/aviation/contrails.pdf,
September 2000. - U.S. Environmental Protection Agency, Inventory of U.S. Greenhouse Gas Emissions and Sinks: 1990-
2001, http://yosemite.epa.gov/oar/globalwarming.nsf/UniqueKeyLookup/LHOD5MJQ6G/$File/2003-
final-inventory.pdf, April 15, 2003. Estimates are presented in units of terragrams of carbon dioxide
equivalents (Tg CO2 Eq.), which weight each gas (e.g., CO2 and NOx) by its Global Warming Potential, or GWP, value. - U.S. Environmental Protection Agency, Inventory of U.S. Greenhouse Gas Emissions and Sinks: 1990-
2001, 2003 op.cit. - Intergovernmental Panel on Climate Change, Aviation and the Global Atmosphere, 1999.
- Actual Emissions 1990-2001 – U.S. Environmental Protection Agency, Inventory of U.S. Greenhouse
Gas Emissions and Sinks: 1990-2001, 2003 op.cit.
- Forecast Emissions 2001-2025 calculated based on FAA long-range activity forecasts assuming a
constant rate of emissions from aircraft. The forecast is deemed conservative since it does not account for
improvements in aircraft energy efficiency over the next 20 years, which are deemed likely. Estimates are
presented in units of terragrams of carbon dioxide equivalents (Tg CO2 Eq.), which weight each gas (e.g.,
CO2 and NOx) by its Global Warming Potential, or GWP, value.
- U.S. Department of Energy, Oak Ridge National Laboratory, Transportation Energy Data Book: Edition
22, http://www-cta.ornl.gov/data/tedb22/Full_Doc_TEDB22.pdf, September 2002.
- US Department of Transportation, Bureau of Transportation Statistics, National Transportation Statistics
2002 (BTS 02-08), Table 4-20: Energy Intensity of Passenger Modes (Btu per passenger-mile), page 281,
http://www.bts.gov/publications/national_transportation_statistics/2002/pdf/entire.pdf.
- See FAR Part 33 – Airworthiness Standards: Aircraft Engines
http://www.airweb.faa.gov/Regulatory_and_Guidance_Library/rgFAR.nsf/CurrentFARPart?OpenView&St art=1&Count=200&Expand=10.
- Colpin, J. and Altman, R., Dependable Power Reinvented, AIAA 2003-2882, AIAA-ICAS International
Air and Space Symposium and Exhibit: The Next 100 Years, July 14-17, 2003, Dayton, OH.
- The use of market-based options for limiting or reducing greenhouse gas emissions from aviation may
also prove potentially useful applied to local air quality emissions.
- Air Transport World, United says cutting APU runtime to save $12 million, ATW Online.com, February
10, 2003.
- International Civil Aviation Organization, Circular 303 - Operational Opportunities to Minimize Fuel
Use & Reduce Emissions, February 2004.
Aviation & Emissions – A Primer
- U.S. Department of Transportation, Federal Aviation Administration, National Airspace System
Operational Evolution Plan, December 2002
- U.S. Department of Transportation, Federal Aviation Administration, Final Regulatory Impact Analysis,
Final Regulatory Flexibility Determination, Unfunded Mandates and Trade Impact Assessment, Reduced
Vertical Separation Minimum Operations in United States Domestic Airspace, March 10, 2003
- Drew, P., et al., Technology Drivers for 21st Century Transportation Systems,” AIAA 2003-2909, AIAA-
ICAS International Air and Space Symposium and Exhibit: The Next 100 Years,” 14-17 July 2003,
Dayton, OH
- Waitz, I. A., Massachusetts Institute of Technology, Aircraft, Gas Turbine Engines and Emissions
Primer, August 3, 2001.
- Intergovernmental Panel on Climate Change, 1999 op.cit.
- ICAO has established a Long-Term Technology Goals (LTTG) task group within Working Group 3 to
monitor and track future aircraft technologies that may demonstrate better environmental performance. The
LTTG will evaluate the prospects for setting emissions goals as targets for future technology performance.
- National Aeronautics and Space Administration, NASA Aerospace Technology Enterprise Strategy –
2003, http://www.aerospace.nasa.gov/strat_plan2003_low.pdf.
- More information on the FAA-NASA Center of Excellence for Aircraft Noise and Aviation Emissions
Mitigation can be found at http://web.mit.edu/aeroastro/www/partner/.
- Waitz, I. A., Massachusetts Institute of Technology, 2001 op. cit., estimates “22 to 37 years total time
from basic technology (e.g. NASA research) to significant fleet impact.”
- National Research Council, Division on Engineering and Physical Sciences, Aeronautics and Space
Engineering Board, Committee on Aeronautics Research and Technology for Environmental Compatibility,
For Greener Skies: Reducing Environmental Impacts of Aviation, available at
http://bob.nap.edu/html/greener_skies/notice.html, 2002.
Aviation Noise: Human Health Risk
Environmental Impacts of Aviation: NOISE
Noise is a Health Risk.
Aviation noise presents a quantifiable human health risk. A body of studies detail the human health risk of noise. The World Health Organization commissioned a landmark study in 2007 on the Noise impacts to human health which challenged the notion that aviation noise is a nuisance. Aviation Noise is a health issue. Many studies have been conducted by renowned scholars and research scientists quantifying the effects of noise on human health. (See below)
According to expert witness Dr. Airline L. Bronzaft, Ph.D. :
"Noise, including airport-related noise, impacts adversely on mental and physical health and well-being is being strongly supported by a growing body of literature, especially from outside the United States. Despite the issuing of the United States Environmental Protection Agency pamphlet "Aviation Noise: Let's get on with the job," ( April 1976), the United States government has been reluctant to support research examining the impacts of aviation noise.
To quote from this document: "We really know what needs to be done. We have simply lacked the will to do it. Let's get on with the job."
It is embarrassing that a government that was once aware of the debilitating effects of noise, as illustrated by excellent EPA publications in addition to one noted above, has chosen not to re-fund Office of Noise Abatement and Control (HR1116), largely "put out of business" by former President Reagan, nor to support research examining effects of noise.
Ignoring the detrimental effects of noise adds further to our economic woes when we factor in the medical costs of the adverse effects of noise on mental and physical health, and the educational costs to remedy the debilitating impacts of noise on our children's cognitive, language and learning skills. "
FAA's Inadequate Noise study
DNL averaging used by NASA and the FAA is known to be an outdated measure inadequately assessing noise impact to human health. Efforts are underway by various health organizations to change the FAA's measures of noise (DNL).
According to the NRDC's 1997 study, "In adapting a threshold of 65 dbDNL, FAA rejected EPA's health based recommendations and chose, instead, to balance the protection of public health and welfare with competing economic and technological considerations".
FAA's Inadequate Noise Abatement Program
The FAA's Noise Abatement guidelines are flimsy at best. It is evident that the FAA regards Aviation Noise as a nuisance rather than as a public health issue. The responsibility of noise abatement has been handed over to the airports, who may have no noise abatement program at all. The airlines are exempt from responcibility. The blame the FAA for noise becuase the FAA's Air Traffic Controllers tell them where to fly. The FAA says they are not responcible for noise. So who will take the burdon of responcibility? Local and regional governments who pass noise ordinances are left with no real way to enforce them. There is a legislative black hole around this public health issue.
The FAA asks local government to form "Noise Response Process" to address incidents where noise levels become intolerable. So, for example, if you are a resident of a community who is under a flight path, the FAA then makes it YOUR responsibility to call a local hotline, lodge a noise complaint with visual sighting of said aircrafts' tail number. The airport then has the responsibility of then contacting the aircraft carriers owner and levying a fine against them for violating the noise abatement procedures.
If a copious amount of calls are made then, in theory, the air traffic controllers will be more apt to redirect flights away from the 'problem' area.
NRDC's report on Pollution effects
Reprinted with permission from the Council on the Environment New York City
Here Is How Noise Hurts Us:
Hearing loss: Continued exposure to noise damages our hearing. The louder the noise, the less time it takes to cause hearing loss. Cells of the inner ear are destroyed, and hearing deteriorates each time we are exposed to prolonged intense sound. These cells do not regenerate. Noise-induced hearing loss is permanent. It is, however, preventable. 28 million Americans suffer from some degree of hearing loss.
Noise does not have to be loud to be harmful. Noise is any sound that bothers us.
Stress: A hazard to our mental and physical well being. Stress is the body's response to outside disturbances. A barking dog or a dripping faucet can trigger our body's responses: heart rate increases, blood pressure rises, the mouth dries, skin loses color, muscles contract, and blood cholesterol rises. Sustained stress reactions to noise can lead to hypertension and ischemic heart disease, sleep disruption, and diminished "quality of life."
Noise Hurts Children, Too!
The loud music that children listen to on the radio, on stereos and earphones, in discos, and at concerts impairs their hearing. Studies have shown that noise interferes with language development, cognition and learning skills. A rule of thumb: If you have to raise your voice while speaking to someone three feet away from you, then your immediate environment could be hazardous to your health. CENYC's Noise Abatement Committee offers assistance to anti-noise groups in the United States and abroad and is actively engaged in educating citizens on the dangers of noise. To receive a copy of CENYC's Noise Brochure, please call 212-788-7900 or email us at cenyc.
Landmark Studies on Noise Impact to Human Health
1. World Health Organization Background Studies and Statements
http://www.who.int/mediacentre/factsheets/fs258/en/
2. NOISE and Health Quarterly International
Health Journal
3. Medical Journal Search of Noise Impacts
Google Scholar search on Noise Health Impacts
4. Pub Med Central Noise Impacts to Human Health
http://www.ncbi.nlm.nih.gov/sites/entrez
5. New England Journal of Medicine
http://search.nejm.org/search?w=noise&search=SEARCH
6. Other Online searchable Medical Journals
http://www.freemedicaljournals.com/
7. ARECO's Noise Impact Studies
http://areco.org/studies.htm#noise
8. Noise Clearing House Links to Study downloads and Bibliographies
http://www.nonoise.org/library.htm
9. Science Journal of Studies
Science Magazine Biblio of Studies on Noise
10. Dr. Arline Bronzaft Ph.D. Landmark Studies
Biblio
Further Reading
1. Environmental Noise Retards Auditory Cortical Development
Edward F. Chang and Michael M. Merzenich
Science 18 April 2003 300: 498-502 [DOI: 10.1126/science.1082163] (in Reports)
2. Noise-induced hearing loss can alter neural coding and increase excitability in the central nervous system
JF Willott and SM Lu
Science 18 June 1982 216: 1331-1334 [DOI: 10.1126/science.7079767] (in Articles)
3. Noise raises blood pressure without impairing auditory sensitivity
EA Peterson, JS Augenstein, DC Tanis, and DG Augenstein
Science 27 March 1981 211: 1450-1452 [DOI: 10.1126/science.7466404] (in Articles)
......to realistic patterns and levels of noise for 9 months, exhibited sustained elevations...return to baseline values after the noise ended. Auditory brainstem responses...Evoked Potentials, Auditory
Publications On Noise Impacts
1. The Path to Quiet: Don't Just Say, "No" to Noise - Say "Yes" to Quiet by Nancy B. Nadler, M.E.D., M.A
2. Dancing Till Deaf by Ed Walsh and edited excerpts by Kathy Peck executive director H.E.A.R. Noise & Hearing - The Facts by Elliott Berger
3. The Campaign For Improved Acoustics In Schools by Peggy B. Nelson, Ph.D., CCC-A
4. Aircraft Noise: The Ailment & The Treatment by Arline Bronzaft, Ph.D.
5. Assert Your Right to Peace & Quiet! by Arline L. Bronzaft, Ph.D.
6. Stop the Noise: An Investigation of Sound Levels in Elementary School
7. Controlling Noise Is in Our Hands by Nancy B. Nadler, M.E.D., M.A.
8. Participants Take Control of Noise by Amy K. Boyle
9. Noise Center Recipe for a Quiet Diet
10. Noise, Sovereignty, and Civility by Les Blomberg
11. Intrusive Community Noises Yield More Complaints by Arline L. Bronzaft, Ph.D., Elizabeth Deignan, M.A., Yael Bat-Chava, Ph.D. and Nancy B. Nadler , M.E.D.,
12. Out of the Mouths of Babes: What Children Say about Noise by Nancy B. Nadler, M.E.D., M.A. and Yael Bat-Chava, Ph.D.
13. It Takes a Silent Village to Harm a Child Arline L. Bronzaft, Ph.D.Volume 22 #1 (1997)
14. Beware: Noise Is Hazardous to Our Children’s Development Arline L. Bronzaft, Ph.D.
15. Noisy Toys -- Some Toys Are Not So Much Fun As They Look Nancy B. Nadler, M.E.D., M.A. Volume 23 #1 (1998)
16. A Voice to End the Governmnet's Silence on Noise by Arline L. Bronzaft, Ph.D.
17. Cognitive Impacts of Noise by environmental scientist Ellen Ivens (Powerpoint Presentation)
18. Hearing Impared Association on Airspace Redesign (Powerpoint Presentation)
19. Hyena Study World Health Organization (PDF)
Links
1. The International Civil Aviation Organization Air Transport Bureau (ATB): is the leading voice in the world on the topic maximizes compatibility between civil aviation and the environment.
2. NRDC Noise Study
3. FAA report
4. World Health Organization Noise impacts
5. League for the Hard of Hearing Noise Studies
6. Noise impacts
7. Federally Funded Noise Abatement Program defunded in the 1970's
8. New Jersey Institute of Technology Impact Analysis (For Design Phase FAA)
9. FAA's Noise Abatement guidelines for Helicopter aircraft
10. WorldWide Fund for Nature International Mark Barrett Studies
11. 2000 Letter to DOT Regarding Noise Abatement procedures
References
1. http://www.faa.gov/regulations_policies/policy_guidance/envir_policy/media/aeprimer.pdf
2. http://www.atag.org/files/FAST%20FACTS-120341A.pdf
3. http://www.iata.org
4. U.S. Department of Transportation, Bureau of Transportation Statistics, Transportation Indicators
http://www.bts.gov/publications/transportation_indicators/december_2002/ , December 2002.
5. U.S. Department of Transportation, Federal Aviation Administration, FAA Long-Range Aerospace
Forecasts Fiscal Years 2015, 2020 and 2025, Office of Aviation Policy and Plans, FAA-APO-00-5,
http://apo.faa.gov/lng00/lng00.pdf, June 2000.
6. GDP - U.S. Department of Commerce, Bureau of Economic Analysis, National Accounts Data
http://www.bea.gov/bea/dn1.htm; RTM - U.S. Department of Transportation, Bureau of Transportation
Statistics, Historical Air Traffic Statistics, http://www.bts.gov/oai/indicators/airtraffic/annual/1981-
2001.html; VMT – U. S. Department of Transportation, Federal Highway Administration, Traffic Volume
Trends, December 2002 http://www.fhwa.dot.gov/ohim/tvtw/02dectvt/tvtdec02.pdf.
7. Wickrama, Upali, International Civil Aviation Organization, Committee on Environmental Protection,
Forecasting and Economic Analysis Support Group, Report of the FESG/CAEP/6 Traffic and Fleet
Forecast, copy of Figure 8, 2003 op. cit.
8. U.S. Department of Transportation, Federal Aviation Administration, Enplanement Activity at Primary
Airports, http://www.faa.gov/arp/planning/stats/2002/CY02CommSerBoard.pdf , November 6, 2003.
9. ICAO has established a Long-Term Technology Goals (LTTG) task group within Working Group 3 to
monitor and track future aircraft technologies that may demonstrate better environmental performance. The
LTTG will evaluate the prospects for setting emissions goals as targets for future technology performance.
10. National Aeronautics and Space Administration, NASA Aerospace Technology Enterprise Strategy –
2003, http://www.aerospace.nasa.gov/strat_plan2003_low.pdf.
11. More information on the FAA-NASA Center of Excellence for Aircraft Noise and Aviation Emissions
Mitigation can be found at http://web.mit.edu/aeroastro/www/partner/.
12. Waitz, I. A., Massachusetts Institute of Technology, 2001 op. cit., estimates “22 to 37 years total time
from basic technology (e.g. NASA research) to significant fleet impact.”
Further Reading
1. U.S. Environmental Protection Agency, MOBILE5a, Office of Mobile Sources, Ann Arbor,
Michigan, February, 1995. Petersen, W.B. and E.D. Rumsey, User’s Guide for PAL 2.0 - A Gaussian Plume Algorithm
for Point, Area, and Line Sources,
2. Environmental Sciences Research Laboratory, Research
Triangle Park, NC, October, 1986. Federal Aviation Administration Office of Environment and Energy Home Page.
http://www.aee.faa.gov/aee-100/aee-120/edms/5yrv01.pdf (accessed January, 2001).
3. Federal Aviation Administration, Consolidated Operations and Delay Analysis System
(CODAS), http://www.apo.data.faa.gov/ibapps/apo/codas/codasindexnew.html (accessed
January, 2001)
4. Society of Automotive Engineers, Procedures for the Calculation of Airplane Noise in the
Vicinity of Airports, Report No. SAE-AIR-1845, 1998.
5. Guiding, J., J. Olmstead, R. Bryan, L. Mirsky, G. Fleming, J. D’Aprile, P. Gerbi, Integrated
Noise Model (INM) Version 6.0, User’s Guide, U.S. Dept. of Transp., Federal Aviation
Administration, Report No. FAA-AEE-99-03, Washington, D.C., August, 1999.
Noise Abatement
According to the NRDC's 1997 study, "In adapting a threshold of 65 dbDNL, FAA rejected EPA's health based recommendations and chose, instead, to balance the protection of public health and welfare with competing economic and technological considerations".
The FAA's Noise Abatement guidelines push the implementation of such rules in to the hands of the air traffic controllers and the pilots. The responsibilty of noise abatement is then shared between the airports, airlines, local and regional government, and citizen of the communites effected.
The FAA asks local governement to form "Noise Response Process" to address incidents where noise levels become intolerable. So, for example, if you are a resident of a community who is under a flight path, the FAA then makes it YOUR responsibility to call a local hotline, lodge a noise complaint with visual sighting of said aircrafts' tail number. The airport then has the responsibility of then contacting the aircraft carriers owner and levying a fine against them for violating the noise abatement procedures.
If a copious amount of calls are made then, in theory, the air traffic controllers will be more apt to redirect flights away from the 'problem' area.
The flaw in this program is that pilots are now encouraged to utilize parks and open spaces which will suffer from the increased air quality degradation, and the newly impacted areas will suffer the same resonsibility of having to report noise until sufficiently heard and then moved to the next community.
FAA documents:
- Noise Control Act of 1972
- An issue paper may be needed to addresses
compliance with Noise Control Act of 1972 and FAA Order 1050.1D, which are
in addition to Part 36 noise requirements. - Part 36 noise requirements for
foreign certified aircraft An issue paper may be needed to address compliance with Part 36 noise requirements for validation projects from certain countries.
- An issue paper may be needed to addresses
Further Reading on Aircraft Noise
- Federally Funded Noise Abatement Program defunded in the 1970's
- New Jersey Institute of Technology Impact Analysis (For Design Phase FAA)
- FAA's Noise Abatement guidelines for Helicopter aircraft
- WorldWide Fund for Nature International Mark Barrett Studies
- 2000 Letter to DOT Regarding Noise Abatement procedures
Bird Strike Committee USA: Bird and other wildlife strikes to aircraft annually cause over $600 million in damage to U.S. civil and military aviation. Furthermore, these strikes put the lives of aircraft crew members and their passengers at risk: over 195 people have been killed worldwide as a result of wildlife strikes since 1988.
Within the United States there was no one forum where information or concerns dealing with this problem could be addressed. Bird Strike Committee USA was formed in 1991 to facilitate the exchange of information, promote the collection and analysis of accurate wildlife strike data, promote the development of new technologies for reducing wildlife hazards, promote professionalism in wildlife management programs on airports through training and advocacy of high standards of conduct for airport biologists and bird patrol personnel, and be a liaison to similar organizations in other countries.
Bird Strike Committee USA is a volunteer organization directed by a 9- to 12-person steering committee consisting of 2-3 members each from the Federal Aviation Administration, U.S. Department of Agriculture, Department of Defense, and aviation industry.
According to the Bird Strike Committee (BSC.ORG):
- Over 219 people have been killed world-wide as a result of bird strikes since 1988.
- Bird and other wildlife strikes cost USA civil aviation over $600 million/year, 1990-2006.
- Over 5,000 bird strikes were reported by the U.S. Air Force in 2006.
- Over 7,500 bird and other wildlife strikes were reported for USA civil aircraft in 2007.
- An estimated 80% of bird strikes to civil aircraft in USA go unreported.
- From 1990-2004, USA airlines reported 31 incidents in which pilots had to dump fuel to lighten load during a precautionary or emergency landing after striking birds on takeoff or climb. An average of 11,600 gallons of jet fuel was released in each of these dumps.
- Waterfowl (31%), gulls (26%), and raptors (17%) represented 74% of the reported bird strikes causing damage to USA civil aircraft, 1990-2006.
- A 12-lb Canada goose struck by a150-mph aircraft at lift-off generates the force of a 1,000-lb weight dropped from a height of 10 feet.
- At least 15,000 gulls were counted nesting on roofs in USA cities on the Great Lakes during a survey in 1994.
- About 90% of all bird strikes in the U.S. are by species federally protected under the Migratory Bird Treaty Act.
The 2008 meeting will be 18-21 August in Orlando, Florida.
References & Further Study
- Pub Med Central- study on Avian respiratory System and Air Quality
- Human Domination of Earth's Ecosystems
- PHD Study on the effects of Air Pollution on Bird species
- Pub Med - Air Pollution fades Plummage of Great Tit
- FAA Wildlife Mitigation Policy
Policy Guidelines:
An agreements between Deputy Administrator for Wildlife Services, Animal and Plant Health Inspection Service and the FAA's Associate Administrator for Airports. These officers have entered into egreement to protect the Wildlife which may become impacted by aviation activity.
Memorandum of Agreement between the Federal Aviation Administration, the U.S. Air Force, the U.S. Army, the U.S. Environmental Protection Agency, the U.S. Fish and Wildlife Service, and the U.S. Department of Agriculture to Address Aircraft-Wildlife Strikes.
Memorandum of Understanding between the United States Department of Transportation, Federal Aviation Administration and the United States Department of Agriculture, Animal and Plant Health Inspection Service, Wildlife Services.
Fuel Jettison over land
Risk analysis studies need to be executed and delivered to area at risk for Fuel Jettison over land. In the new NAR, the land is a preferable route to the sea where Fuel Jettison Risk was mitigated.
No impact studies have been executed by the FAA on this topic. Guidelines were requested however in 2000.
- Studies over water
- Biological And Health Effects Of Exposure To Kerosene-Based Jet Fuels And Performance Additives Glenn Ritchie a; Kenneth Still b; John Rossi III b; Marni Bekkedal b; Andrew Bobb b; Darryl Arfsten; Geo-Centers, Inc., Wright-Patterson Air Force Base; Naval Health Research Center Detachment-Toxicology, Wright-Patterson Air Force Base
DOI: 10.1080/10937400306473
Published in: Journal of Toxicology and Environmental Health, Part B, Volume 6, Issue 4 July 2003, pages 357 - 451
- FAA Regulations & Policies
- Transportation research board studies on impacts of Aviation Jet engine emissions on flora and Fauna.
- Impact to Flora Fauna find latest Studies on Flora Fauna through Google Scholar
- Center of Atmospsheric Science Seminars
|
National Academies Study on Aircraft Emissions on Wetlands Evaluating Particulate Emissions from Jet Engines: Analysis of Chemical and Physical Characteristics and Potential Impacts on Coastal Environments and Human Health Journal Authors Abstract: The results of this study suggest that the range of size of particulate emissions from some jet engines clusters below 1.5 ?m and that the emissions contain heavy metals. Therefore, jet exhaust particulates (JEPs) have the potential to adversely affect both the environment and human health. Little is known about the particulate component of jet engine emissions. Baseline physical and chemical data on JEPs were obtained to evaluate their potential effects on the environment. Particles collected from the exhaust stream of two types of jet engines were examined using scanning electron microscopy. Analysis indicated that 100 percent of the particles collected were below 1.5 ?m in size. Particles in this size range can penetrate to the alveoli of human lungs. Chemical analyses of jet engine exhaust were conducted in an attempt to identify chemical fingerprints that would distinguish aviation emissions in the environment from other anthropogenic emissions. Certain heavy metals, especially vanadium, were found in jet exhaust and may be useful chemical fingerprints. Analysis of JP-5 fuel standards revealed a suite of alkylbenzene hydrocarbons, which may also aid in fingerprinting aviation emissions. Sediment samples taken at coastal wetlands near airports indicated the presence of the same heavy metals as those found in jet exhaust samples. Field sites exposed to higher volumes of air traffic contained higher levels of sediment heavy metals, supporting the hypothesis that aerial deposition of heavy metals is occurring in areas near some airports. |
Global Warming & The Jet Engine
According to the Intergovernmental Panel on Climate Change Aviation Jet emissions directly contribute to global warming(1.):
- Aircraft emit gases and particles directly into the upper
troposphere and lower stratosphere where they have an impact
on atmospheric composition. These gases and particles alter
the concentration of atmospheric greenhouse gases, including
carbon dioxide (CO2), ozone (O3), and methane (CH4); trigger
formation of condensation trails (contrails); and may increase
cirrus cloudiness—all of which contribute to climate change in the stratosphere.
According to an article published Dec 6, 2006 in USA Today, Gary Stoller writes:
Aviation and the environment are on a collision course." The number of airline flights worldwide is growing and expected to skyrocket over the coming decades. Aircraft emissions pollute the air and threaten by 2050 to become one of the largest contributors to global warming, British scientists have concluded.
|
New York Times Article published Jan 7, 1992:
Global Warming Threat Found in Aircraft Fumes |
Links
Studies on Global Warming and Aviation
- NASA/Boeing inventories (Scheduled, Civil, Global) for 1976, 1984, 1992 and 1999 [Baughcuma,b 1996 and Sutkus 2001]
- Aviation and The Global Atmosphere (Columbia University Press) [Intergovernmental Panel on Climate Change 1999]
- ANCAT/EC2 (Civil and Global)inventories for 1991/92 [Gardner 1998]
- DLR (Civil and Global) inventories for 1992 [Schmitt 1997]
- AERO-MS inventories for 1992 [Pulles 2002]
- SAGE was developed by FAA in large part because there was no up-to-date non-proprietary model that could be used to estimate aircraft emissions on a global level. As such, FAA developed SAGE (now at Version 1.5) from the best publicly available data and methods in order to provide the international aviation community with a high-fidelity tool that can be used to analyze various policy, technology, and operational scenarios. So far, SAGE has been used to develop inventories for 2000-2004. The current commitment from FAA is to continue development and validation of SAGE to produce inventories of fuel burn and emissions on a yearly basis.Get the report here
References
- Baughcuma, S.L., T.G. Tritz, S.C. Henderson, and D.C. Pickett. “Scheduled Civil Aircraft EmissionInventories for 1992: Database Development and Analysis.” NASA CR 4700. April 1996.
- Baughcumb, S. L., S. C. Henderson, and T. G. Tritz. “Scheduled Civil Aircraft Emission Inventories for 1976 and 1984: Database Development and Analysis.” NASA CR-4722. 1996.
- Federal Aviation Administration (FAAa). “System for assessing Aviation’s Global Emissions (SAGE), Version 1.5, Technical Manual.” FAA, Office of Environment and Energy. FAA-AEE-2005-01.September 2005.
- Federal Aviation Administration (FAAb). “System for assessing Aviation’s Global Emissions (SAGE),Version 1.5, Validation Assessment, Model Assumptions and Uncertainties.” FAA, Office of
Environment and Energy. FAA-AEE-2005-03. September 2005.
- Gardner, R. “Global Aircraft Emissions Inventories for 1991/92 and 2015, Report by the ECAC/ANCAT and ED Working Group.” Editor: R. M. Gardner. EUR18179. 1998.
- Intergovernmental Panel on Climate Change (IPCC). “Revised 1996 IPCC Guidelines for National Greenhouse Gas Inventories, Reference Manual (Volume 3).” http://www.ipccnggip.
iges.or.jp/public/gl/invs6.htm. 1997.
- Intergovernmental Panel on Climate Change (IPCC). “Aviation and the Global Atmosphere.” A Special Report of IPCC Working Groups I and II. Edited by J.E. Penner, D.H. Lister, D.J. Griggs, D.J. Dokken, and M. McFarland. Cambridge University Press. 1999.
- Pulles, J.W. “Aviation Emissions and Evaluation of Reduction Options (AERO), Main Report.”
Ministry of Transport, Public Works and Watermanagement, Directorate-General of Civil Aviation, the Hague. ISBN 90-369-1792-1. July 2002.
- Schmitt, A., B. Brunner. “Emissions from Aviation and their Development over Time". In Final Report on the BMBF Verbundprogramm, Schadstoff in der Luftfahrt. DLR-Mitteilung 97-04, Deutches Centrum Fuer Luft- and Raumfahrt. 1997.
- Sutkus Jr., Donald J., Steven L. Baughcum, and Douglas P. DuBois. “Scheduled Civil Aircraft Emission Inventories for 1999: Database Development and Analysis.” National Aeronatics and Space Administration (NASA) Glenn Research Center, Contract NAS1-20341. NASA/CR-2001-211216. October 2001.
- United Nations Environment Programme (UNEP)/World Meteorological Organization (WMO). Article 4 of the Framework Convention on Climate Change published by the UNEP/WMO Information Unit on Climate Change (also identified in Article 12). See <http://unfccc.int>. 2000.
World Health Organization Study on Noise impacts to Human Health
Intergovernmental Panel on Climate Change Aviation and Global Warming
The Australian government have conducted environmental studies on health, social, environmental, mental impacts to aircraft noise, emissions and vibrations. Based on these finding, they have adopted legislation which specifically protects the airline industry from full control of airspace.
Below is an excerpt from their findings which has been incorporated into Australian law.
|
HARMONIC VIBRATION IMPACTS FROM AIRCRAFT
|
|
Harmonic vibrations can be caused in buildings and in items within buildings by the "Any proposal for airspace change that may lead to a change in the pattern or |
NRDC's report on Pollution effects
Jet Engine Impact on Endangered Species
Australia Governmental impact study Analaysis
FAA Flawed Impact Study Paradigm(FEIS)
The plan is non-inclusive of impact to all effected communities and has been deemed inadequate by lawmakers, environmentalist and other experts in the field. The FAA did not hire outside firms to gauge impact to all the effected areas as suggested early in the design phase by industry experts, nor did they meet with all the communities directly effected by the changes. The Office of the Inspector General audited the FAA's project and found that risks are not effectively mitigated which the FAA agreed to in 3rd Q 2005.
KNOWN PROBLEMS WITH FAA's ENVIRONMENTAL STUDY:
|
HMMS Review of Airspace Redesign FEIS
NJIT Recommendations To FAA
Studies provided and funded in part by the FAA during planning phasesDuring the FAA's beginning design phase many studies were conducted giving guidance on design, development and execution of the specific projects within the redesign initiative.
It is evident however that the plan being implemented does not take the expert expert advice and guidance outlined in the New Jersey Institute of technology Report
an excerpt:
|
NJ Institute of Technology Review
Noise impact: Noise impact should be calculated for the entire study area. The value of quiet, or conversely, the cost of noise, is more difficult to quantify than the added cost of aircraft fuel utilized due to arrival or departure delays. However, full and fair weighting requires dollar impact values as well as descriptive measures of all considerations. A noise impact study should include but not be limited to: |
References and Further Reading
1. Anderson, C., S. Augustine, Embt, and T. Thrasher, Emission and Dispersion Modeling
System (EDMS) Reference Manual, U.S. Dept. of Trans., Federal Aviation Administration,
Report No. FAA-AEE-97-01, Washington, D.C., April, 1997.
2. U.S. Environmental Protection Agency, MOBILE5a, Office of Mobile Sources, Ann Arbor,
Michigan, February, 1995.
3. International Civil Aviation Organization, Aircraft Engine Exhaust Emissions Databank,
Defence Evaluation and Research Agency,
, last accessed, March, 2001.
4. U.S. Environmental Protection Agency, Compilation of Air Pollution Emission Factors, AP-
42, Fifth Edition, Research Park, N.C., May, 1998.
5. Petersen, W.B. and E.D. Rumsey, User’s Guide for PAL 2.0 - A Gaussian Plume Algorithm
for Point, Area, and Line Sources, Environmental Sciences Research Laboratory, Research
Triangle Park, NC, October, 1986.
6. Benson, P., CALINE3 - A Versatile Dispersion Model for Predicting Air Pollutant Levels
Near Highways and Arterial Streets, Report No. FHWA/CA/TL-79/23, California Dept. of
Transp., Office of Transp. Laboratory, Sacramento, CA., Nov., 1979.
7. Federal Aviation Administration Office of Environment and Energy Home Page.
http://www.aee.faa.gov/aee-100/aee-120/edms/5yrv01.pdf (accessed January, 2001).
8. Cimorelli, A.J., S.G. Perry, A. Venkatram, J.C. Weil, R.J. Paine, R.B. Wilson, R.F. Lee, and W.D. Peters, AERMOD - Description of Model Formulation, Draft, Environmental Protection
Agency, Office of Air Quality Planning and Standards, Research Triangle Park, NC, December,
1998.
9. U.S. Environmental Protection Agency, User’s Guide for the National Nonroad Emissions
Model - Draft Version, Ann Arbor, MI, June 1998.
10. Federal Aviation Administration, Consolidated Operations and Delay Analysis System
(CODAS), http://www.apo.data.faa.gov/ibapps/apo/codas/codasindexnew.html (accessed
January, 2001).
11. Society of Automotive Engineers, Procedures for the Calculation of Airplane Noise in the
Vicinity of Airports, Report No. SAE-AIR-1845, 1998.
12. Guiding, J., J. Olmstead, R. Bryan, L. Mirsky, G. Fleming, J. D’Aprile, P. Gerbi, Integrated
Noise Model (INM) Version 6.0, User’s Guide, U.S. Dept. of Transp., Federal Aviation
Administration, Report No. FAA-AEE-99-03, Washington, D.C., August, 1999.
13. Wayson, R.L., G. G. Fleming, W. L. Eberhard, B. Kim, W. A. Brewer, J. Draper, J. Pehrson, and R. Johnson, 2003: The use of LIDAR to characterize aircraft exhaust plumes, Proceedings, 96th Ann. Meeting of AWMA, San Diego, CA, Air and Waste Management Association.